Section 1.1 Definition of a Function

In this section, we will definine a function and learn how to identify the input and output variables of graphs, tables, diagrams, and equations.

Definition 1.1.1.

A function is a relationship between two variables where every input corresponds to exactly one output.
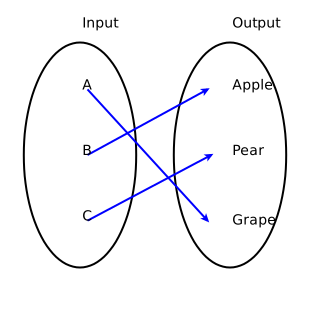
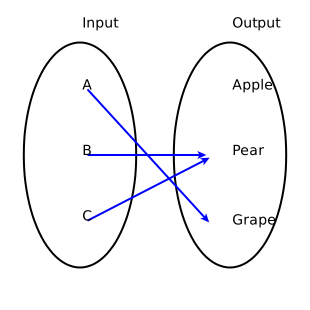
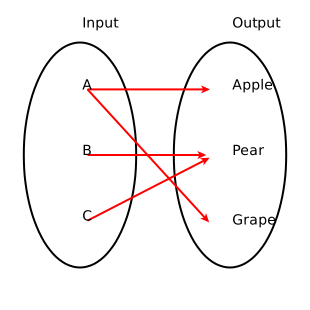
Below, in FigureΒ 1.1.2 and FigureΒ 1.1.3 we have two examples of relationships which are functions. Notice that each input A, B, and C is mapped to exactly one output value. Two inputs can share the same output value, but each input must have a unique output value.
For example; in the first diagram, FigureΒ 1.1.2, each input is going to a different output value. In the second diagram, FigureΒ 1.1.3, inputs B and C are both going to the same output value of Pear, but each input is still going to a single output value.
Figure 1.1.2.
Figure 1.1.3.
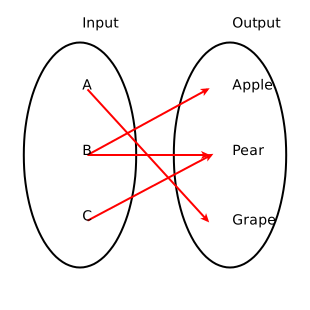
In contrast, the diagrams below are both examples of relationships that are not functions. There is an input which has two different outputs in each diagram.
In the first diagram, FigureΒ 1.1.4, input B is going to both output values of Apple and Pear. In the second diagram, FigureΒ 1.1.5, input A is going to both output values of Apple and Grape.
Figure 1.1.4.
Figure 1.1.5.
Depending on the situation, we may refer to the relationship between a function and its inputs and outputs as a mapping, a correspondence, or a rule. We also have several ways to represent functions. We can use a table, a graph, a diagram, or an equation.
So far we have seen functions represented as diagrams. Before we can move on the others, we need to learn about function notation.

Definition 1.1.6.

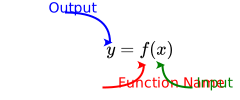
The representation of a function \(y=f(x)\) is called function notation. The letter \(f\) is the name of the function, and the letter \(x\) is the input variable, and the letter \(y\) is the output variable. We say that \(y\) is a function of \(x\text{.}\)
Figure 1.1.7.
Let’s look at some examples showing function relationships using function notation.

Example 1.1.8.

In the first diagram, FigureΒ 1.1.2, we could use function notation to represent the same relationship:
\(f(A) =\) Grape. "The input A is mapped to the output Grape."
\(f(B) =\) Apple. "The input B is mapped to the output Apple."
\(f(C) =\) Pear. "The input C is mapped to the output Pear."
We would first need to name the function \(f\) as it was not given a name in the diagram.

Example 1.1.9.

The number of visitors, \(V\text{,}\) to the Omaha Zoo is given by the function \(V = g(t)\text{,}\) where \(t\) is the number of years since the year 2000.
In this example, the input variable is \(t\text{,}\) which represents the number of years since 2000. The output variable is \(V\text{,}\) which represents the number of visitors to the zoo. The name of the function is \(g\text{.}\)